Powerful Data Analytics. Without the Complexity.

Vizzi Analytics combines visual workflows, powerful data processing, built-in analytics and AI assistance so more people can work directly with data — without requiring everyone to become a programmer.

Build visually when you want simplicity. Use SQL and advanced capabilities when you need more control.
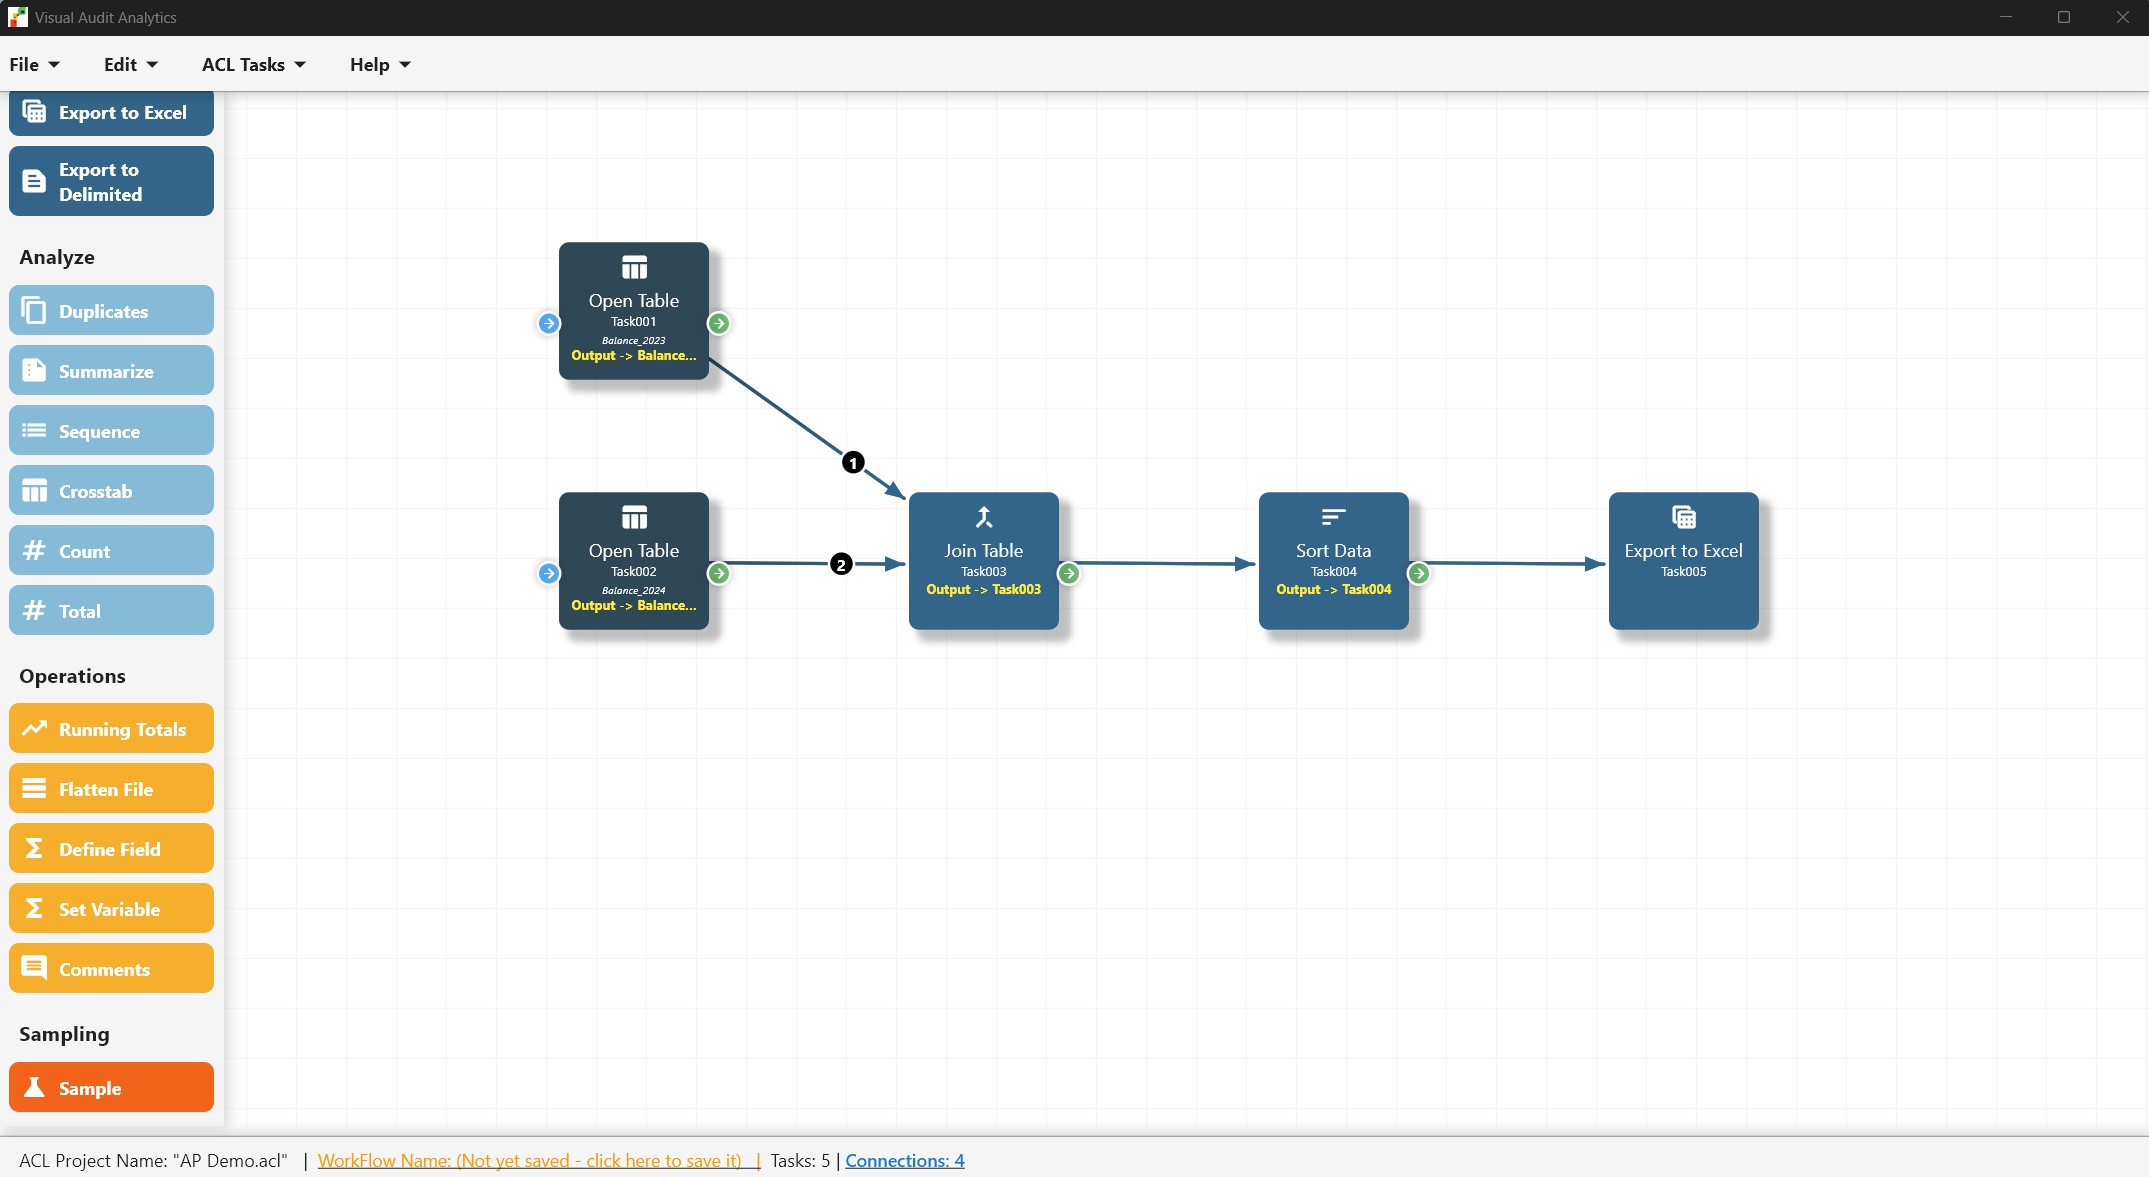
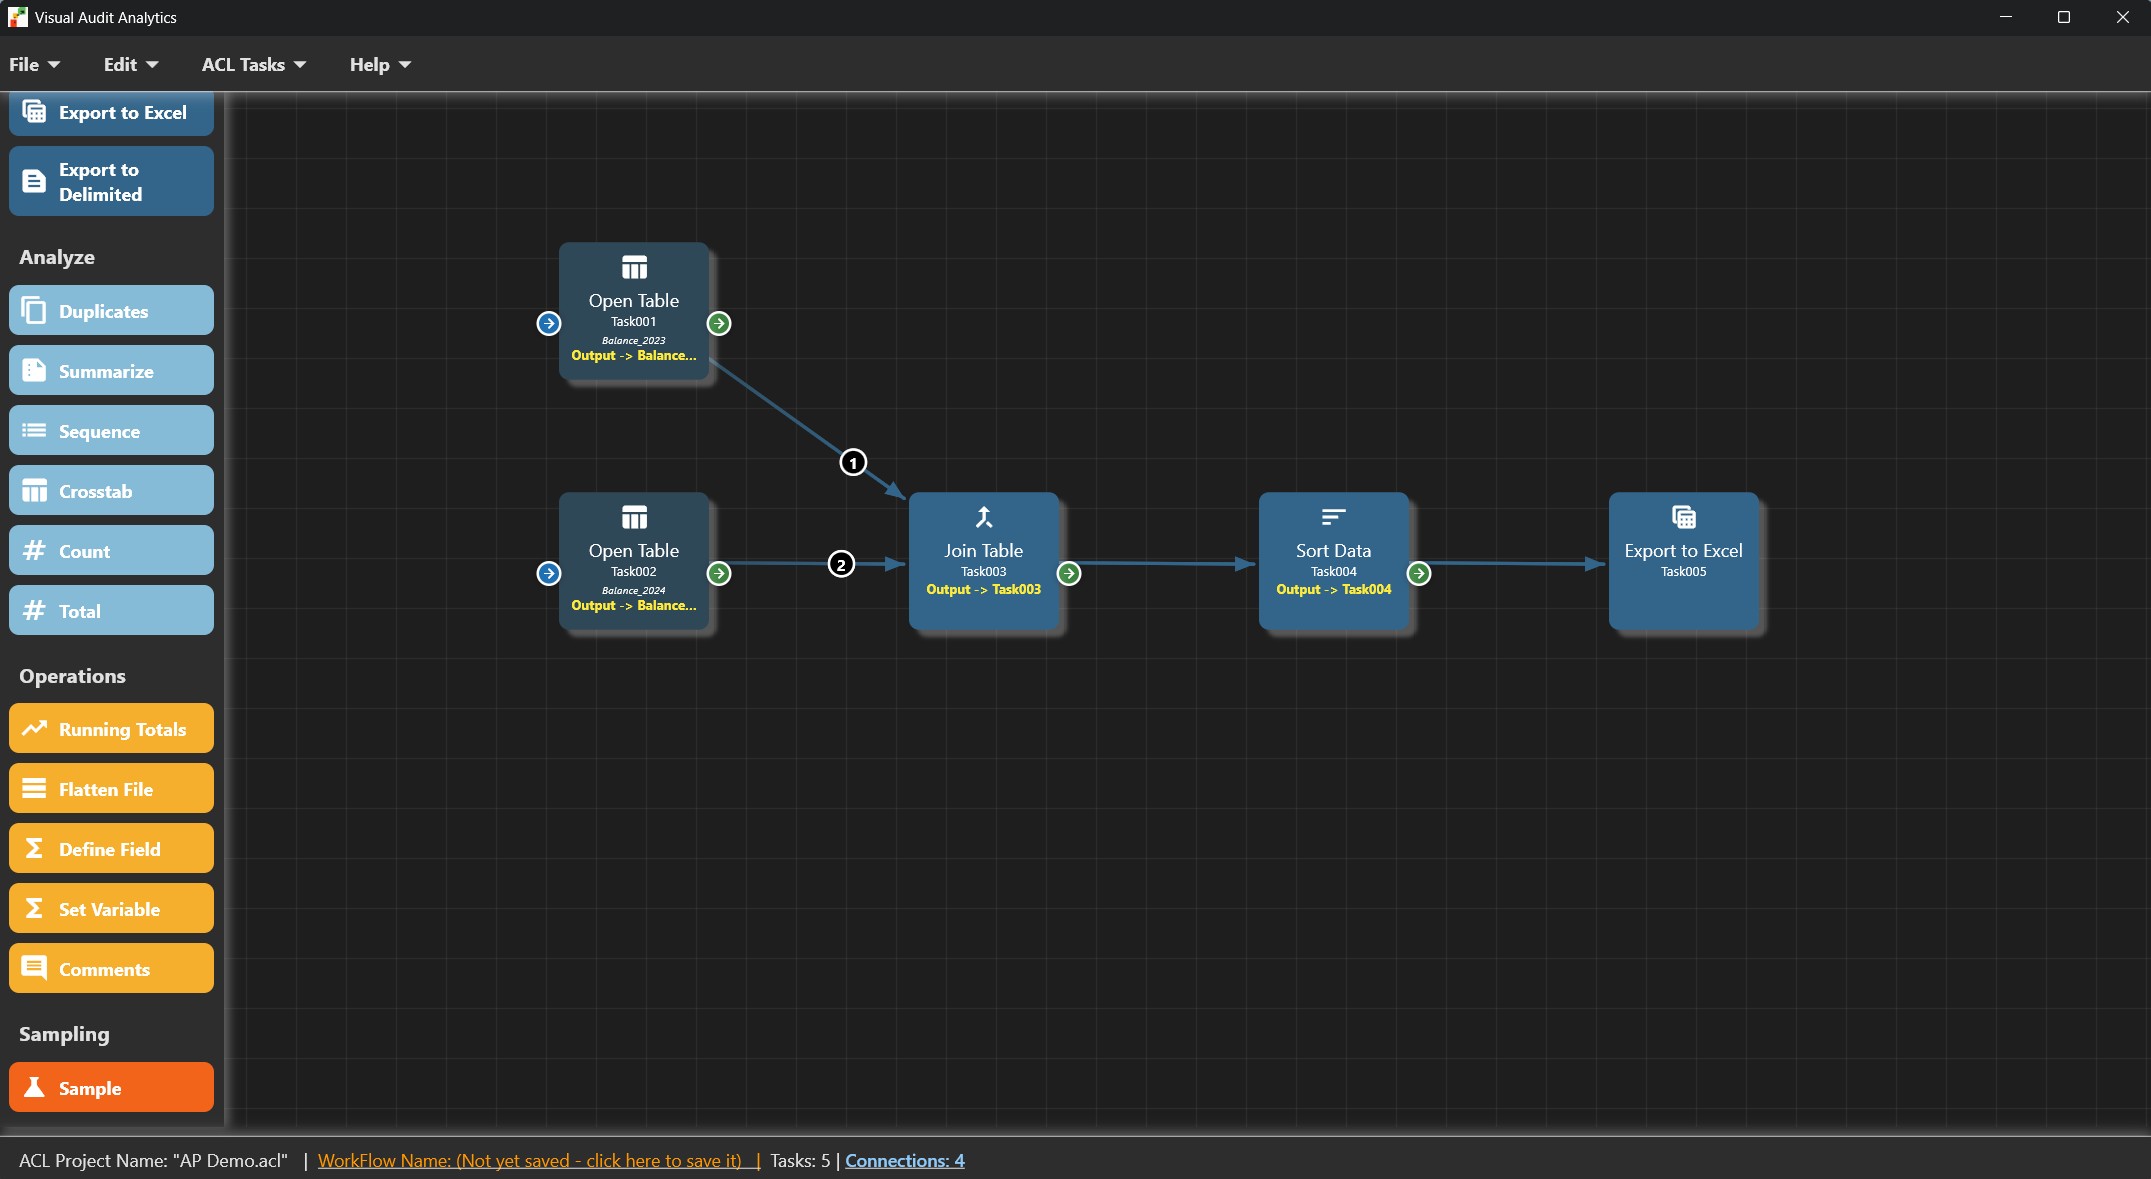
A Vizzi Analytics visual workflow connecting data sources, analysis tasks, and results

Build Analytics Visually

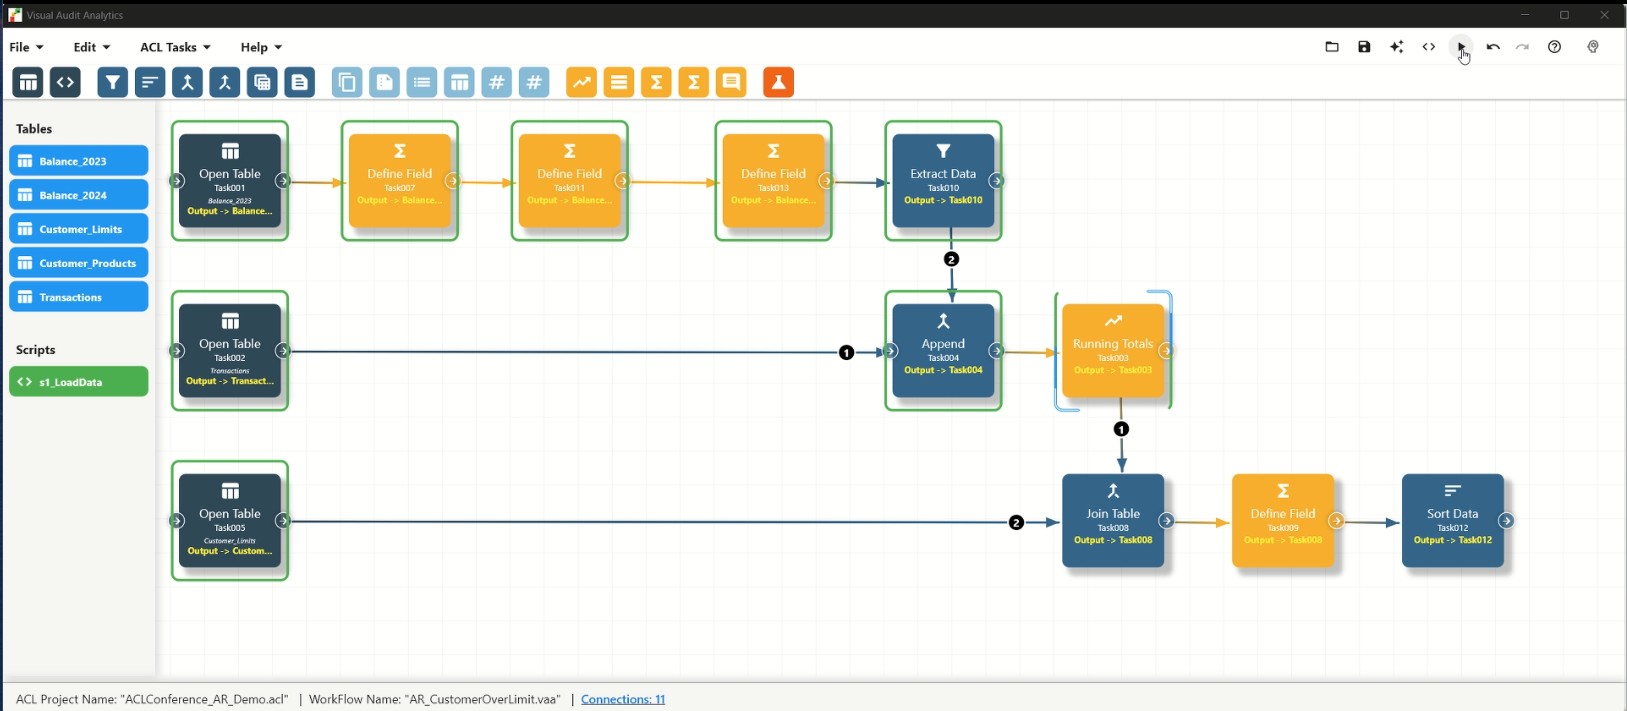
Turn complex analysis into clear visual workflows. Connect data preparation, transformation, testing and reporting steps together so users can see exactly how data moves through the analysis.

  • Build workflows using visual analytics tasks
  • Connect tasks to create multi-step analysis
  • Add tasks directly into an existing flow
  • Run from a selected point in the workflow
  • Disable tasks without deleting them
  • View data while building and testing the workflow
  • Save and reuse flows for recurring analysis
  • Make complex analytics easier to understand, review and explain
A multi-step Vizzi Analytics workflow on the design canvas

Visual workflows are the core of Vizzi: each step stays visible, so the analysis is easier to build, review and hand over.

Connect to the Data You Already Use

Bring together files, databases, reports, APIs and existing analytics projects without forcing users into a single data source or format.

Files

  • Excel
  • CSV
  • Parquet
  • JSON
  • Google Sheets

Reports

  • Print reports
  • PDF reports

Databases and APIs

  • ODBC connections Beta
  • REST APIs Beta

Existing analytics

  • Vizzi projects
  • ACL projects and tables
  • Arbutus tables

Secrets Manager

Secrets Manager is more than a password store. Use it to save API tokens, connection strings and passwords so those values are not hard-coded into workflows.

Details are encrypted and stored locally on your computer, then referenced by name when a connection or API call needs them. Confidential values are not written to system logs.

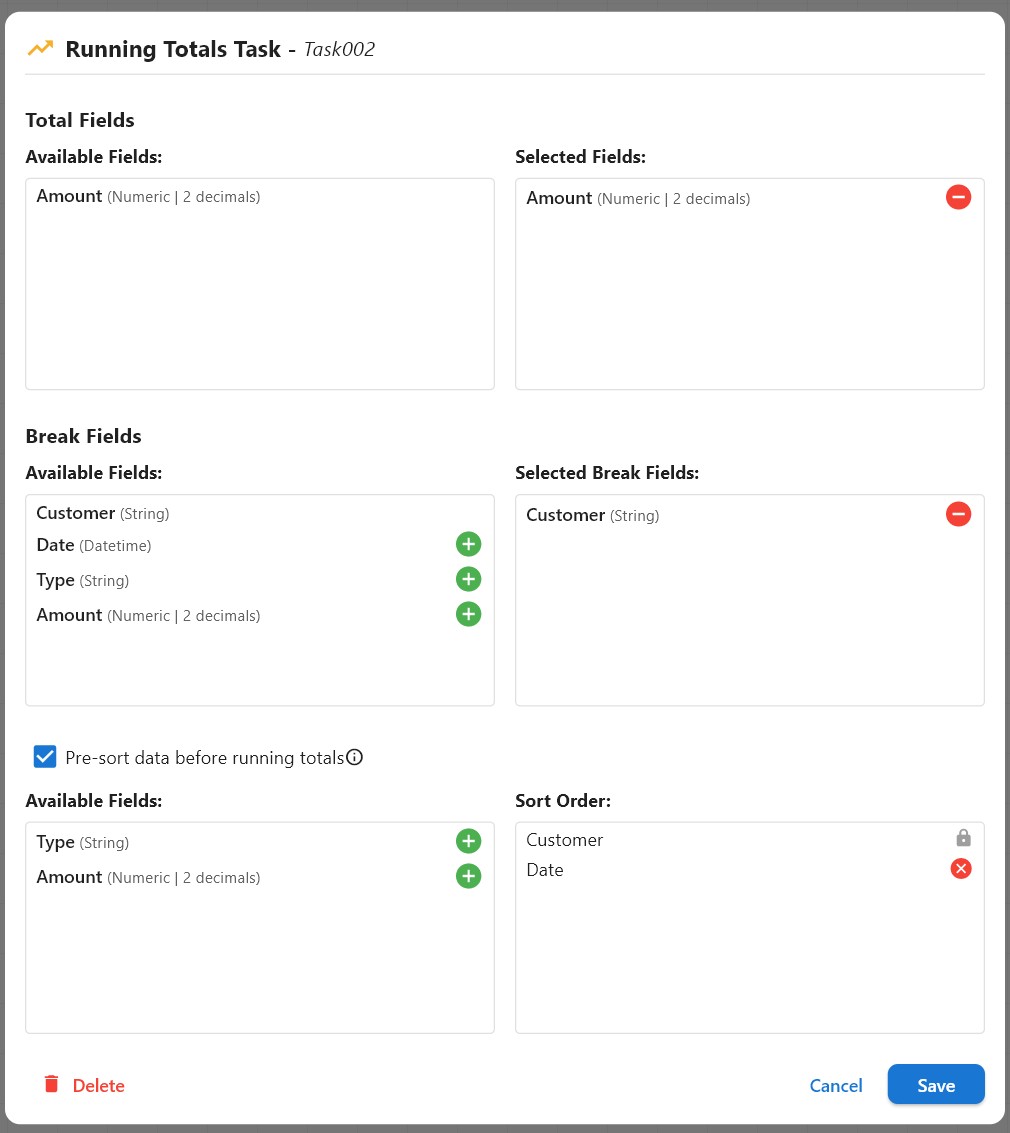
Configuring a data transformation task in Vizzi Analytics

Prepare and Transform Data Without Writing Code

Clean, combine, reshape and enrich data using visual tasks. Turn raw source data into analysis-ready datasets without building long scripts or complex formulas.

Typical work in a Vizzi workflow includes filtering and extracting records, sorting, joining and appending tables, crosstabs, unpivoting, cleaning and standardizing fields, splitting text, find and replace, flattening structured files, calculated and static fields, renaming, changing data types, handling nulls, and running totals.

From messy source data to analysis-ready data — all within the same visual workflow.

Filter and extract records
Join and append tables
Clean and standardize fields
Create calculated fields
Unpivot and crosstab data
Change types and handle nulls

Find the Transactions and Patterns That Matter

Use built-in analytics tasks to test complete datasets, identify exceptions and quickly focus attention on the records that deserve investigation. These capabilities are used in internal audit, and they are equally useful in finance, compliance and general data analysis.

Duplicate detection
Fuzzy duplicate matching
Gap and sequence testing
Sampling
Unique value analysis
Counts, totals and statistics
Stratification and summarization
Conditional testing
Exception identification
Reconciliations
Full-population testing

Go beyond exact matches

Identify records that are similar but not identical, such as inconsistent vendor names, descriptions or other text values. Fuzzy matching helps surface potential duplicates and related records that exact matching would miss.

Analyze Millions of Records

Move beyond spreadsheet limitations and work with complete datasets. Vizzi uses a high-performance analytical engine designed to process large volumes of data efficiently on your computer.

  • Analyze complete populations containing millions of records
  • Efficient filtering, joining, grouping and calculations
  • SQL-backed execution with DuckDB
  • Local data processing on your computer
  • SQL access when specialists want more control

Visual workflows for most users. SQL when specialists want it.

Users can perform analytics visually, while experienced analysts can inspect or use SQL when they need greater control.

Designed for complete populations

Millions of records

Your analysis does not need to be uploaded to Vizzi's cloud. Data processing takes place locally, helping organizations maintain control over their data.

Use AI to Build Analytics — Not Just Talk About Them

AI assistance is built directly into the analytics process. Use it to help create calculations, build logic, troubleshoot problems and design analysis without constantly switching to a separate chatbot.

  • Create calculated fields from plain-language instructions
  • Build conditional logic
  • Generate, explain and troubleshoot SQL
  • Suggest approaches for analyzing unfamiliar data
  • Help design analytics tests
  • Assist users when they get stuck
  • AI-assisted workflow creation where supported
  • Work with supported AI providers
  • Cloud-based or local/private AI options where available

AI should make data analysis easier — not require users to become AI experts.

Build Dynamic, Reusable Analytics

Replace hard-coded values with variables so the same workflow can adapt to different periods, thresholds, locations and business requirements — without turning the analysis into a programming exercise.

Hard-coded Amount > 50,000

Change the variable once and reuse the same analysis without rebuilding the workflow.

Materiality thresholds
Reporting dates
Sample sizes
File and folder locations
User-defined parameters
Values generated during analysis

Build Once. Run Again Automatically.

Recurring analytics should not need to be rebuilt every month or quarter. Create the workflow once, refresh the source data and run the same analysis again — for internal audit, finance, compliance, continuous monitoring and recurring reporting.

  • Save reusable workflows
  • Refresh or replace source data
  • Rerun consistent analysis
  • Schedule workflows
  • Support monthly, quarterly or ongoing analysis
  • Command-line execution where applicable
  • Generate repeatable results
  • Apply the same business logic from period to period

Turn one-time analysis into a repeatable process.

A saved Vizzi workflow that can be rerun against refreshed data
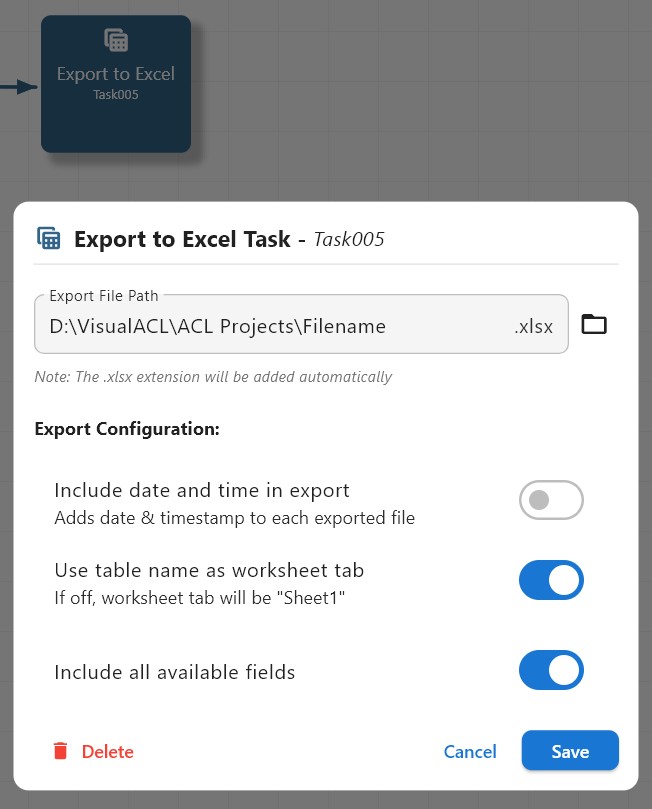
Exporting analysis results from Vizzi Analytics

Turn Analysis Into Results You Can Use

Investigate results directly in Vizzi, create visualizations and export the information you need for reporting, review or further analysis.

Your workflow does not end when a test produces results. Continue investigating, transform the results further, visualize them or export them for review.

  • View and investigate result tables
  • Continue analyzing output from previous tasks
  • Keep intermediate working tables in the project
  • Export results to Excel, CSV and Parquet
  • Export visualizations to PNG

Visualizations

Bar, column, line and area charts. Pie and donut charts. Scatter plots.

Tables and working data

Review exceptions, keep intermediate tables, and keep analyzing inside the same project.

Export

Excel, CSV and Parquet for data. PNG for charts you need to share.

Understand and Review Every Step

Analytics should be understandable by more than the person who built them. Vizzi makes the analysis visible so workflows are easier to review, explain, repeat and hand over to another team member — including in audit, finance and compliance environments where work may need to be reproduced.

Reviewers can also ask the built-in AI to explain what a test does and why it could be important for an audit, in language that is easier to follow than raw task settings or SQL.

  • Visual representation of the complete analysis
  • Clear task configuration
  • Execution logs
  • Traceability of processing steps
  • Review intermediate results
  • Reproducible, repeatable workflows
  • Repeatable test evidence
  • Easier handover between team members
  • Save workflows with projects

See how the answer was produced — not just the final result.

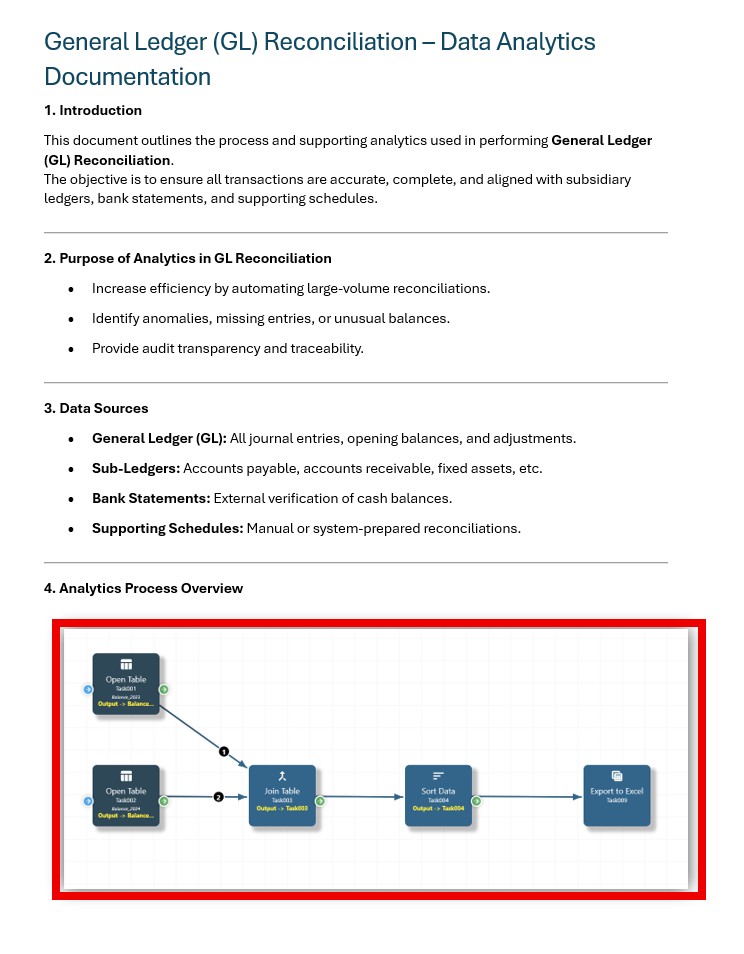
A documented analytics workflow that others can follow and review

Documenting audit work performed

Include a screenshot of the visual workflow so a reviewer can see what was done without reconstructing the logic from scratch. Export results to Excel, and visualizations to PNG where they help the file. Then use the built-in AI to produce a first draft of your audit notes. The analysis, supporting results and explanation can all be managed in Vizzi.

Bring Your Existing Analytics With You

Moving to an easier analytics environment should not mean abandoning years of existing work.

See What Your Team Can Do With Vizzi Analytics

Build powerful analytics, work with complete datasets and automate repeatable analysis — without requiring everyone on your team to become a programmer.